Thursday, September 4, 2014

Pay Attention To Stock Markets Of China & Russia


Usually at the end of every month I summarise sentiment of major asset classes via a newsletter update. However, since the sentiment conditions have not changed all that much since the last month, I thought that it would be appropriate to look at a topic that I get quite a few emails about:global stock markets and which one to buy or sell? In this issue of the newsletter I will look back at several decades of history to see the price and performance of various global stock markets and why I think big moves might be coming in Emerging Markets stocks… particularly Russian, Chinese and various other Asian indices.

Chart 1: Over the last 5 years, US equities have returned 20% per annum
S&P 5 Year Compound Return Source: Short Side of Long
However, before I start there needs to be a word of caution. United States is still a global financial leader, with the deepest and most liquid markets. It’s stock market is still one of the main driving forces that impacts many other regional stock markets around the world. Therefore, it is very prudent for investors to understand that the future returns of the US stock market could be very vulnerable from here onwards.
If we observe Chart 1, we should be able to see that the 5 year rolling compound rate of return for the S&P 500 was recently as high as 20 percent per annum. In other words, over the last 5 years, investors have enjoyed on average a 20% return per year, every year. Not only is this rate of return incredible, but it is also a historical anomaly at two standard deviations above a 140 year history.
Using Robert Shiller’s data dating back to late 1800s, this type of rate of return over half a decade has only occurred four other times. These were into 1929, 1936, 1987 and 2000. These dates should all sound very familiar as the stock market experienced a major crash in every instance over the coming 12 to 24 months. Does that mean another crash is coming? There is definitely a decent risk that it is.
Chart 2: Chinese equities have consolidated since the 2007 blow off top
Chinese & Indian Equities Source: Short Side of Long
So now that we have warning massage out of the way, let us look at what is cheap both nominally and relative to the US. Keep in mind that I will not be discussing any in-depth fundamentals regarding countries or regions, as it is your own job to do fundamental research. I will also not be discussing in-depth valuations metrics for various countries, as this is also something you need to do as your own homework. What I will be discussing is the price and performance of various global stock markets, which could be more attractive from the value investing perspective.
If you have been a regular reader of the blog, you most likely would have paid attention to the recent posts regarding Emerging Markets. Previously, I have covered extremely low EM price to book valuations, price breakout and breadth participation improvements. I have also discussed a possibly that Chinese stocks have bottomed out; and even if they haven’t that there is a strong probability of outperforming US equities either way.
Chart 3: Chinese equities are staging breakout from a 7 year downtrend
Chinese Stocks Source: Bar Chart (edited by Short Side of Long)
Assuming you are an investor with a long term perspective, one should definitely look at China as an investment opportunity right now. We should all know a thing or two about China and its future path of becoming a dominant country in the 21st century. And as contrarians we should all participate in this story as it unfolds. However, the best time to buy China is when others are bearish as they are today. This gives us a potential of better (cheaper) entry points as the country continues it secular rise towards more developed economic future.
Gauging sentiment isn’t always easy. Away from the fund flows, analyst recommendations and various surveys, on my last trip around Asia I really got to feel the negativity towards the China’s future economic prospects. Various trades, brokers, analysts and bankers I had a pleasure of meeting were all expecting disappointment from China in coming years (all but a handful I met in Singapore – you know who you are). One trader that works for a major investment bank in Hong Kong even told me that he was afraid that China could crash and end up being more of Pakistan or Zimbabwe, rather then the next great country.
The negative mood has been present all while earnings keep improving. The market traded at forward price to earrings ratio of almost 25 during the 2007 blow off top (please refer to Chart 4). This was one of the most expensive valuations in the last 15 years. At the same time, the 5 year rolling compound rate of return reached 50% (observe Chart 2 closely). In other words, Chinese equities were gifting investors a 50% return on average very year for the last 5 years into 2007. Wow!
These days the valuations are quite low, as the index trades just slightly over 8 times forward P/E. Furthermore, priced in US Dollars, Chinese stocks have been in a downtrend for 7 years now. This is a completely different story to the record breaking run of US equities since March 2009. So could the Chinese market now play catch up? Looking at Chart 3, we can see that some type of change could be taking place as the index attempts a breakout!
Chart 4: Russian equities are currently at incredibly cheap valuations!
BRIC Valuations Source: Ed Yardeni
Russian stocks, on the other hand, are even cheaper and for the obvious reasons too. The crisis in Ukraine continues to escalate, which is putting selling pressure on all Western and Eastern European stock markets. Growth has once again came to a grinding halt in Eurozone, while Russia is now most likely entering a technical recession. Sanctions are currently hurting both sides and for these reasons (and many others) Russian stocks have not entered a recovery mode like their Chinese counterparts (see in Chart 5).
At forward price to earnings ratio of below 5, which is usually only witnessed at major bottoms like 1998 / 2001 / 2008, I believe that Russian stocks a great investment prospect. And while we are on the topic of sentiment and negative outlook, Russia probably takes one of the top spots here. While Chinese stocks might be a buy right now, I would probably start purchasing Russian stocks on any future meaningful weakness.
Some of the indicators to look out for would be a further spike in Russian interest rates, as well as a collapse in both business and consumer confidence. Certain investors might question this and wonder why would I want to purchase Russian stocks if these major economic indicators deteriorate? After all, rising interest rates would hurt economic growth via falling profits and slower credit growth. At the same time, a collapse in confidence from both consumers and businesses indicates a major slowdown of economic activity.
Well, my answer to this would be that markets are a discount mechanism, so from a contrary point of view as bad news is becomes more and more priced in, a sound bottom can be made and a recovery eventually restart. And since stocks are the cheapest during times of economic slowdown or geopolitical tensions, just as others are selling you should be buying. In other words, gloom and doom is investor’s best friend.
Chart 5: Russian stock market remains in a downtrend for the time being
Russian & Brazilian Equities Source: Short Side of Long

Source: http://shortsideoflong.com/2014/09/august-sentiment-summary/

Why Indians do not like to invest in equities?

Do you know what is the Wimbledon effect? Well it is the location – the Wimbledon is in UK, but no Englishman ever wins it !!

Similarly when the Indian stock markets go up, the participants are mostly White men in US or UK.

Why are Indians shy of investing in Equities? Well Sucheta Dalal and Ravi Narayan have their reasons about this..and I am giving mine…

1. The whole media right from the beginning keeps saying ‘Equities are Risky’ – of course most people in the media business do not understand the word risky. If media started saying ‘Adjusted to inflation and for volatility equities give real returns over long periods of time’ – in a way that the common man understood, it would make sense.

2. There is a conspiracy of the rich – if people have to be kept engaged from birth to death in acquiring a car, a house, education for children, a bigger house…the best way is to keep them away from wealth creating assets. The rich do this very well by controlling the banks (who make it cheaper to fund a new car), and make people chase vacations, etc…

3. People invest as per their greed and Risk-Return expectation. So people bought shares in Global Trust Bank (greed that it will become a big bank) and kept money in Fixed Deposits of GTB. When the bank failed the SHAREHOLDERS lost everything (price for greed) but the FD holders got THEIR FULL AMOUNT back (with those ridiculous rates of interest). So the message is – take risk on FDs, not on equity.

4. The government keeps coming out with a new regulation regularly – in the capital market.

5. If the bond markets, the national savings certificates, k v p, are dematerialised and opened to trade by the members of the stock exchange, brokers will penetrate the country much better…and increased market penetration will take equities also to the masses. This is unlikely to happen – the government will not want competition at the bottom of the pyramid – the cost of borrowings will shoot up dramatically.

6. Share market movements look scary the way it is presented on tv. If a tv anchor can show the impact of inflation on savings, people would react better. You remember what you read earlier, right? The real rich control the media.

7. As the government owns all the banks, banks do not fail. Regular bailing out of banks ensures that people do not worry about bank deposit failing. This means just all the money goes to banks…14 lakh crores….is not a small amount lying in banks..

8. Pathetic Corporate Governance – in the PSU and the private sector too. This dissuades the real long term investor.

9. People not bothering about who is going to feed them from age 55 to the rest of their lives. Longevity, Inflation, Old Age care, etc. do not seek to worry them when they are 22…

Source: http://www.subramoney.com/2014/09/why-indians-do-not-like-to-invest-in-equities/#sthash.xKlznzHb.dpuf

Wednesday, September 3, 2014

Adani Port and SEZ: Jain Matrix

Key Reasons to Invest:

  • AP’s Mundra Port and Indian operations are excellent infra assets with Revenues, EBITDA and Profits up by 36%, 32% and 50% CAGR over the last 5 years.
  • AP can emerge as a port sector dominator in 3-4 years. The currently govt. dominated Indian Port sector is constrained on capacity and efficiency, offering a large opportunity. 
  • Divestment of the Abbot Point Port, Australia has de-risked the business.
  • It has only medium debt, and the cash flow is likely to improve in coming quarters. 
  • Risk: Environmental review and SEZ clearances by Govt. of India. 
This is an update of my Sept 2012 report ‘Adani Port – The Great Australian Adventure’ available here.

Adani Port – Description and Profile

  • Adani Port and SEZ – (AP) is Gujarat based firm with FY13 revenues 3841 cr and PAT 1639 cr (consolidated).
  • The Founder/Chairman of AP is Gautam Adani, a self-made entrepreneur.
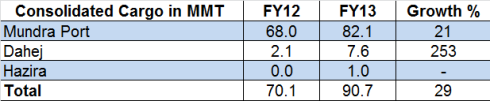
  • AP businesses include Mundra Port, the largest private port – 82mmt in FY13, an adjacent SEZ area of 6,500-hectare and several terminal operating contracts at other Ports in India. (mmt is million metric tonnes Cargo)
  • Mundra Port was #2 among Indian ports in FY13, with a 15% market share, and has become #1 this year. It trades in a diverse cargo base like bulk, liquid, project cargo and container, implying lower business risks.
Mundra Port
  • It’s a private port, so Mundra is free to price its services, unlike the PSU ports in India. It has ‘take or pay’ arrangements with many of the customers. This protects AP from sudden drops in demand.
  • AP is also developing and operating terminals at Hazira, Mormugao, Dahej, Hazira, Kandla and Vizag in India. AP as an operator now has a presence in seven ports in India.
  • Connectivity and logistical facilities connect the Port, berthing and storage facilities to Roads, Rail, Airstrip and Pipelines for goods transportation. Growth in Cargo was 29% in FY13. See Exhibit 1.
Consolidated Cargo, JainMatrix Investments
Exhibit 1 – Port Operations Growth, JainMatrix Investments
  • The Shareholding in % is Promoters 75.0, MFs/DII 5.1, FIIs 15.0, Individuals retail/HNI 3.1 and Others 1.8.
  • Adani Enterprises is the holding company with cross-holdings in Adani Power and AP. The group is focused on sectors of Coal, Mining, Port Logistics and Power generation, and the three firms execute on this plan.
  • The vision for AP is to increase annual cargo handling capacity from 91 mmt in 2013 to 200 mmt by 2020.

Events, News and Strategies

  • In Q1FY14 Mundra Port overtook Kandla to emerge as India’s largest port by handling 24 mmt (Kandla 23).
  • The Abbott Point Port, Australia was acquired by AP in June 2011. But in Mar 2013, it was divested to its promoters, freeing AP of a complex foreign asset and large debt, so it can concentrate on Indian operations. Post a valuation exercise, the entire debt and equity used for this purchase was bought out.
  • In early May, the Union government granted security clearance to AP, thereby allowing the firm to participate in port/ terminal bids, removing a restriction that was placed on it in November 2010.
  • Tata’s Mundra UMPP and Adani Power obtained approval from the CERC for a revision of power tariff due to rising imported coal costs. This coal is routed through Mundra Port.
  • Adani Group is exploring a listing of holding company Adani Enterprise on an overseas bourse, to raise cash and help reduce debt at a group level. If this succeeds, it will trigger a price appreciation.
  • The promoters of AP recently reduced stake to SEBI specified 75%, raising 1,000 cr via Institutional placement.
  • New Projects: Possible investments include the Dharma Port, a new port on the East coast. This high potential port has the deepest draft and cargo capacity of 25mmt in place, with a long term expansion plan to 100mmt.
  • Tie ups with Maersk and Mediterranean Shipping Co. (MSC), the world’s top container shipping lines should help increase cargo volumes in Mundra. Ports assets at  Hazira and Dahej will see full utilisation from FY14.

Industry Note:

  • 95% of India’s international trade is done through the Sea Ports. Traffic projections for next 8 years are 11% growth CAGR (Shipping Ministry). As Imports and Exports grow rapidly, the constraint will be Port capacities.
  • Mundra Port is able to provide port access to industries in Gujarat, Maharashtra and North Indian regions. It has an excellent location and the connectivity has been well developed.
  • The Central govt. Ports are constrained in terms of low tariffs; and terminal operators are not incentivized to grow volumes, resulting in stagnant capacities and falling market share. Most of the major ports are operating near the full capacity, resulting in high per-berthing detention and turnaround time of vessels.
  • Ports capacity needs to be increased for better service and operations. This is a big opportunity for AP.

Stock Valuation, Performance and Returns 

Share Price and Dividend, JainMatrix Investments
Fig 2 – Share Price and Dividend, JainMatrix Investments
  • The IPO of AP in Nov 2007 was successful. It was oversubscribed 115 times, and provided listing gains. However it was aggressively priced, at 88 (Rs, adjusted). See Fig 2.
  • There was a split in Sept 2010, from FV10 to FV2.
  • IPO investors have seen a 6% CAGR returns since listing. The Dividend has increased steadily, till the current 50%, i.e. Re 1 on FV Rs 2. This gives a dividend yield of 0.8%.
  • Volatile Prices – Share price rose post IPO to 264, fell to 50 in Nov’08, rose again to a high of 185 in Oct’10, before dropping to today’s 131.
Adani Port Quarterly Sales and Profits, JainMatrix Investments
Fig 3 – Adani Port Quarterly Sales and Profits, JainMatrix Investments
  • The 5 year growth has been rapid, with Revenues, EBITDA and Profits up 36%, 32% and 50% CAGR, Fig 3.
  • With higher volumes, the margins have reduced, so Operating Margins are 64% and PAT Margins are 28%.
Cash Flow and Financial Ratios, JainMatrix Investments
Fig 4 – Cash Flow and Financial Ratios, JainMatrix Investments
  • Debt-equity is 1.67, down from recent highs. This is fair for an infra company, Fig 4.
  • All infra companies incur high initial investments to create the assets. This is true of AP, which has a medium Cash flow due to recent investments in new terminals and capacity expansions.
  • EPS (adjusted) is up 45% CAGR in recent years.
  • Fig 5 tracks the market price of AP against its P/E, ttm. The PE for AP has been in a range of 15-45 times over 5 years. But current PE of 14.3 is at low end of this range.
Adani Price and PE Chart, JainMatrix Investments
Fig 5 – Adani Price and PE Chart, JainMatrix Investments
Adani Price and EPS Chart, JainMatrix Investments
Fig 6 – Adani Price and EPS Chart, JainMatrix Investments
  • The chart (Fig 6) plots the market price against the adjusted EPS over the period.  EPS shows us a steady quarterly increase indicating stable business performance.
  • Return Ratios are improving – ROCE is 13% (7.8% in FY12) while RONW is 25% (23% in FY12).
  • Our calculation of the PEG is 0.47 (0.55 in FY12), which indicates an undervalued stock.

Benchmarking and Financial Projections

We have benchmarked AP with comparable leaders from other sectors, Exhibit 7:
Benchmarking, JainMatrix Investments
Exhibit 7 – Peer Benchmarking, JainMatrix Investments
It appears that AP valuations look rich; the Sales & Profits are steady; Low asset turnover; Return ratios are good, while debt is high, and Interest coverage is low. The explanation is that:
  • AP has always been perceived as a pioneer/ leader, so it has had higher valuations.
  • AP has large assets that can be exploited, so the SEZ land bank is a key asset that can be monetized.
  • Acquisition of assets like Dharma Port may involve large investments but over time the Returns will improve.
Financial Projections:
Here are the 2 year financial projections for AP, Exhibit 8.
Financial Projections, JainMatrix Investments
Exhibit 8 – Financial Projections, JainMatrix Investments
Note – The financial projections in my Sept 2012 report were actually exceeded by AP in FY2013 by Turnover – 28%, EBITDA – 53% and Profits – 13%, partially due to the divesting of the Abbot Point asset, and rest due to overall excellent performance !! However, the share price is still not reflecting this.

Risks

  • A panel set up by the Ministry of Environment and Forests (MoEF) to evaluate the firm against a PIL and complaints reports that AP flouted green norms. The possible result of this is a penalty/ fine that will be used to take corrective steps in the Mundra Port region.
    • Certainly AP will have to modify its policies and ensure compliance in future.
  • One of the criticisms of AP has been that this group is very aggressive, and in its push for growth and volumes ignores aspects like environment and safety systems and procedures.
  • Gujarat High court in a May 2012 court order has stayed development work at AP due to unauthorized construction over a 1,840-hectare enclave that was not vacant, and had no Central environmental clearance – this may delay additional construction for the SEZ area.
    • AP has reapplied for the SEZ status for this parcel of land.
  • Outside the AP business, the Adani Group includes Adani Enterprises and Adani Power. As of now these two group entities have a troubled business outlook in terms of high debts, mining sector clampdowns, high costs of coal imports and poor financials. This may affect AP prospects directly or indirectly.
  • In absolute numbers, AP consolidated debt is 10,600 cr (Mar 2013), of which 7,500 cr is in foreign exchange.
    • As per reports, the forex debt is naturally hedged by marine/ container income, for interest & repayment.

Opinion, Outlook and Recommendation

  • Seaports are very critical infrastructure for India. While imports have grown tremendously recently, we expect exports to also pick up and accelerate in the coming years. Almost 95% of merchandise Ex-Im is transported by seaports. The 5-9% GDP growth range in India is now testing the capacities of Indian Ports.
  • Govt. ports so far have been constrained in terms of capacity, speed of execution and pricing.
  • AP’s Mundra Port and other Indian operations are excellent. AP will capture market share due to investments in capacity, good connectivity, excellent facilities, speedier turnarounds and proximity to demand centers.
  • AP is quickly emerging as a street smart and very aggressive competitor in the Port terminal construction and operation space, across cargo categories. With AP bidding for and setting up terminals even in PSU ports, AP in the next 3-4 years may be able dominate the sector. With large market share will come pricing power and better margins.
  • With the exit from the Abbot Point Port, the EPS growth may continue in the high 40% for the next 3 years.
  • The price has fallen 30% from the 175 peak in May 2013. PE has fallen to new lows. This provides a good entry point for long term investors.
  • Investors may consider AP as a Medium Risk, High Gain stock. Our call is BUY with a 2 yr perspective.
Source: http://jainmatrix.com/2013/08/26/adani-port-aug-2013/

Larsen & Toubro: Jain Matrix

L&T is a buy at these levels. The key positives are:
  • Diversified across a business verticals like Construction, Roads, Oil & Gas, Power, Fertilizer, Ship Building, Water, Railways, IT and Finance, & a big international presence.
  • Management has a reputation for excellence and professionalism.
  • Good growth with Revenues, EBITDA and PAT gaining 22%, 31% and 20% CAGR over 5 years.
  • Valuation is below historical averages. The share is 32% below highs from 5 years ago.
The negatives are
  • Expected share performance is dependent on domestic economic and investment recovery.
  • Early signs of stress in the balance sheet due to high debt and cash flow challenges. 
L&T, JainMatrix Investments

Business Snapshot:

  • L&T is a professionally run Indian conglomerate with focus on Engineering & Construction.
  • The consolidated turnover is Rs. 65,000 crores and Profits 4,700 cr (FY12). Institutions like Mutual Funds, Banks, FIIs and Insurance companies hold 53% stake, with no promoter in sight.
  • The business areas are Engineering & Construction Projects, Infrastructure, Manufacturing, IT and Financial Services. The leader is AM Naik who is the Exec. Chairman. It has about 45,000 employees.
  • International business may be contributing over 25% of revenues.
The main revenue segments are:
L&T Segment Revenues FY11, FY12, JainMatrix Investments
Fig 1 – L&T Segment Revenues, JainMatrix Investments 

Pricing Snapshot

The 10-year view of the share price of L&T shows us:
  • The share reached its all time high of 2163 in Nov’07, and even today 5 years later is 32% below this. It also fell to a low of 379 in Mar’09, before recovering. See Fig 2.
  • The share price has appreciated 42% CAGR over 10 years, making it a top wealth generator.
  • The share is a volatile large cap, and Reuters estimates the Beta as 1.48.
Price History, Jainmatrix Investments
Fig 2 – Price History, Jainmatrix Investments 

Financial Snapshot 

L&T Financials, JainMatrix Investments
Fig 3 – L&T Financials, JainMatrix Investments  
  • The Consolidated Revenues, EBITDA and PAT have gained by 22%, 31% and 20% CAGR over 5 years.
  • EBITDA margin is near the peak of 20%, but PAT margin at 7.2% is below the 12.2% peak.
  • P/E has thus moved in a wide range of 15-30 times, and today is at 22 times. Fig 4. At this level, L&T looks cheap and just below historical average PE level of 22.5 times.
  • Dividend has continually increased, and today’s 825% at FV Rs 2 gives a dividend yield of 1.1%.
Price and PE chart, JainMatrix Investments
Fig 4 – Price and PE chart, JainMatrix Investments 
  • Consolidated Total Debt and Cash Flow data are analyzed in Fig 5.
Price and EPS chart, JainMatrix Investments
Fig 5 – Price and EPS chart, JainMatrix Investments 
  • The total debt of L&T has grown faster than Revenues in the last 5 years. While there are a number of new projects, and revenues have grown, but these are soaking up cash, due to Public-Private type projects, or longer payment cycles, or higher working capital requirements.
  • While Free Cash Flow is negative in FY12, when seen in proportion to Revenues, it is not too high. The DE ratio is at 1.74, below the danger level of 2.0 for such companies.
  • The standalone firm has an order book of 1,45,723 cr. in FY12, so L&T has a Booked to Billing ratio of 2.7 times. This is a healthy ratio among EPC firms.

Opportunities and Concerns

Opportunities
  • L&T has a very wide portfolio extending from Building Construction, Roads, Oil and Gas, Power, Infrastructure, Switchgear, Defense, Fertilizer, Ship Building, Water and Railways. In addition it has operations in India and abroad. In India, the growth areas have been Metro construction in cities, the new dedicated Freight corridor, Oil and Gas projects, Roads, Power Gen. and transmission, etc.
  • L&T is able to react to growth opportunities and sectors and focus on these. The FY13 focus has been on international business, which has grown better than domestic. This is in the form of new regional teams. There have also been a number of new technical partnerships.
  • L&T enjoys an excellent reputation as a professional and technically strong team.
  • L&T has also worked on internal improvements like streamlining the structure, Vertical focus, spin-off of noncore businesses and investment into growth areas. These are bearing fruit.
  • L&T sees value in listing arms and selling JV stakes, as part of its strategic plan, called Lakshya. L&T Finance was listed in 2011, and is today a fast growing diversified NBFC with a 15,000 crore mkt cap that is 83% owned by L&T. Another listing prospect is L&T Infotech.
Concerns
  • L&T with its EPC capabilities is a play on the Industrial growth and capacity expansion in India. But the GDP growth has been falling to lows of 6.5% (FY12) and 5.5% (FY13). In terms of infrastructure, there have been problems like high interest rates, govt. clearances, SEB solvency, etc. However, the government is focused on easing the process of infra creation by removing bottlenecks. In terms of GDP, it is expected that the worst is behind us, and there should be a rebound in the future.
  • Interest rates in India are among the highest in the world. While the govt. fights inflation, the rates have affected growth and new projects. But expectations are the rates will reduce in a few quarters.
  • Competition for L&T across businesses is intense, from domestic, MNC firms and Chinese suppliers.  

Opinion, Outlook and Recommendation

  • The Indian economy is today on a recovery path. There is an urgency in the government reforms, a thrust on infrastructure and an attempt to boost Investments, foreign and Indian. Growth imperatives will push down interest rates, and the capex Investment cycle may sputter back to life.
  • Globally, the Middle East retains its attractiveness, the only worry being social and war tensions.
  • Management quality, integrity and stability are big positives. Strategic, structural and financial directions from management have helped L&T ride through the bad phases in the Indian economy. A turn for the positive in the economy will see the L&T share making big gains.
  • L&T stock is a buy today based on a conviction that the firm has the scale, the diversity and the vertical and geographical width to respond fast to growth opportunities.
  • Advice: Invest for the long term.
Source: http://jainmatrix.com/2013/01/24/larsen/

Mahindra Holidays: Jain Matrix

  • Mahindra Holidays is an Indian leader in Vacation Ownership/ Timeshare. It has an excellent brand and is part of a prestigious group. In its business segment, it is a revenue and market share leader.
  • It has added significant capacities in the past years, in India and abroad. The next few quarters should see MH being able to monetize these assets.
  • The 52% fall in share price in the last 3 years should thus be seen as an opportunity to BUY the share at a lower price, and better entry valuations.  

Business Snapshot:

Mahindra Holidays is a leader in Indian Leisure Timeshare
  • Mahindra Holidays and Resorts (MH) is a Travel & Tourism firm and a leader in Vacation Ownership.
  • MH had Revenues of 637 crores and Profits 105 cr in FY12.
  • The MD & CEO is Rajiv Sawhney. MH is part of the USD 16 billion Mahindra group.
  • MH has over 1,55,000 members (customers), and 40 resorts with 2,200 rooms. There has been an aggressive increase in room inventory in the past few years. (Fig 1). The resorts growth strategy too is mapped in Fig 1.
  • Started in 1996, the company’s flagship brand is ‘Club Mahindra Holidays’.  Other brands in the portfolio are Zest Breaks, Club Mahindra Fundays and Mahindra Travels.
Fig 1 – Resorts and Members, JainMatrix Investments
  •  Revenues are from Members, who 1) buy the timeshare/ initial payment 2) annual subscription charge 3) Spend on services during the stay 4) unused rooms sold to non-members (like any resort).
  • Promoter hold 83%, while rest is with Institutions 4.5%, Individuals 6% and Others 2.5%. This is a good sign. But the Promoters may need to divest their holding to 75% soon.

Pricing Snapshot

The available 4-year share price history of MH shows us:
  • The IPO was in June 2009, and pricing was Rs 300 . It got oversubscribed 9.8 times.
  • The share has been quite volatile, as from a post IPO price of 395 in July 2009, it rose to a peak of 574 in March 2010, then fell to a low of 255 in May 2012. See LINK 
  • Today at 275, it has given a negative return to IPO investors over 4 years.

Financial Snapshot

Fig 2 – Financials Snapshot , JainMatrix Investments
Fig 2 – Financials Snapshot, JainMatrix Investments
  •  Consolidated Revenues, EBITDA and PAT have gained by 14%, 4.2% and 6.7% CAGR over 5 years. While revenues are good, EBIDTA and PAT margins have fallen.
  • P/E has moved in a range of 23-41 times, indicating the perceived leadership position of MH.
  • The total debt of about Rs 1070 cr (FY12) does not look too high, when we see that the D/E is 2.0 on an overall basis. Dividend at 40% gives a dividend yield of 1.45%.
Fig 3 – Consolidated Cash Flows are positive, JainMatrix Investments
  • Further, the Free Cash Flow mapping can be seen in Fig 4. Except for FY10, the FCF is zero or positive. We can see that a number of new resorts and new rooms have been added at MH – Fig 1. In spite of this addition, MH has maintained positive FCF. This is a good sign of financial control.

News, Opportunities and Concerns

News
  • MH has added international locations like Austria, Bangkok, Pattaya and Kuala Lumpur. It has obtained a license to operate in the UAE and is looking to make this operational soon.
  • MH is proceeding with a stake sale under the offer for sale (OFS) route on 7th March 2013. It has fixed ‘floor price’ at Rs 270 per share for the sale of its 4.02% in the company, to fetch around Rs 92 cr. The company is offloading shares to comply with SEBI’s guidelines on minimum public shareholding. The OFS received a good response, and was subscribed 1.3 times.
  • 40% of bookings today are done through their Interactive Online portal, from zero 15 months ago.
Opportunities
  • Leisure travel in India is at an early stage of growth, and is a function of affluence and lifestyle.
  • As per MH data, the total VO membership is 3.5 lakh (giving MH a 44% membership marketshare). The target market is households with annual income> 17 lakhs, which numbers 30 lakhs. Thus there is ample opportunity, of over 8 times for this industry.
  • MH has an excellent brand of Club Mahindra, something that is well recognized and valuable. Plus the rub off of the Mahindra group.
  • 90% of the MH resorts have a rating of 4 or over out of 5 on TripAdvisor. This is an excellent rating.
  • MH is able to fund capex from membership fees and internal accruals. This is financially prudent.
Concerns and Threats 
  • The current economic slowdown can slow discretionary expenditure at consumer level.
  • Resort and rooms addition is a very capital intensive exercise, and something MH should not overstretch itself on.
  • Looking at the 5 star hotel industry in India, the annual demand growth for hotel rooms remaining subdued at around 7 per cent in 2012-13 and 2013-14. This will be compounded by large-scale room additions: CRISIL Research expects 14,500 rooms to be added in 2013-14 to the existing 46,200 rooms. This is a negative indicator for the demand for MH.

Opinion, Outlook and Recommendation

  • MH is emerging from a 2-3 year period of investments in room addition. In this period, it has managed to add to its number of members, and has a good inventory of rooms available for them.
  • All this has been done without overstretching the balance sheet, and with just a small blip on the financials.
  • The OFS activity will also make available additional funds to MH for corporate use.
  • The business outlook in the next few years for MH is positive.
  • The fall in share price of 52% from the peak in March ’10 to today should be seen as an opportunity to buy a strong business at a lower cost.
Source: http://jainmatrix.com/2013/03/08/mahindra-holidays/

Bajaj Finance: Jain Matrix

Bajaj Finance is an NBFC on a rapid growth path. It is a leader in auto and consumer durable loans, and a strong contender for a Banking license. Key strengths are diversified business segments, good product range, broad geographical reach, strong ‘Bajaj’ brand and nimble business model. The performance has been steady in 2013, and operational metrics are good, with low NPAs. Gains can accelerate for Bajaj Finance if the Bank license comes through. Invest in this high potential mid cap.

This is a follow-up report to the one published in Jan 2012, entitled – Bajaj Finance, Auto-matic Growth.

Business Profile

  • Bajaj Finance (BFL) is a NBFC promoted by Bajaj Auto 26 years ago. Key management personnel are Rahul Bajaj – Chairman, Sanjiv Bajaj – Non Executive Vice Chairman and Rajeev Jain, CEO.
  • The total Income in FY13 was Rs 3111 crore and PAT 591 cr.  
  • BFL’s products portfolio includes loans for Consumer Durables, Personal use, Against Property & Securities, for Small Business, Construction Equipment, and Insurance Services. See Figs 1 & 2. About 60% of its business is consumer oriented – B2C, while rest is B2B, with a SME focus.
  • About 30% of the 2&3 wheelers of Bajaj Auto are today financed by BFL. In the last 6-7 years, BFL has converted itself into a professional, diversified financing company.
  • BFL has a network of 7,000+ distribution franchise across 112 cities, and 80 lakh plus customers.
  • In 2013, BFL added 1,565 permanent employees, taking the total employee strength to 3,090. This is a sign of business confidence and investments in expected growth.
Business Segments, JainMatrix Investments
Fig 1 – Business Segments, JainMatrix Investments
  • Funds sourcing – CRISIL has rated it at FAAA/Stable for FDs (high safety on timely payment of interest and principal), A1+ (short-term debt) and AA+/stable (long-term debt) by CRISIL & ICRA.
  • The share-holding pattern is 62.1% Promoters, and public shareholding includes 11.3% individuals, 10.2% FII’s, mutual funds/UTI 7.9%, and bodies corporate 7.3% and 1.2% others.
Fig 2 - Product offerings, JainMatrix Investments
Fig 2 – Product offerings, JainMatrix Investments
Recent News and Updates
  • BFL had a Rights issue in Jan 2013, and raised 750 cr. The issue ratio was 3:19 and pricing Rs 1100.
  • BFL extended its consumer electronics financing business recently to digital product financing.
  • BFL also launched a rural financing initiative in 7 branches and 30 spokes in Maharashtra.
  • The total customers acquired in Q3 FY14 grew by 15%.
  • The firm’s borrowing mix from banks & money market is 60:40. This appears a balanced mix.
  • The Bajaj Group has applied for a Bank license from RBI, which is expected to be issued in early 2014. There are totally 25 applicants. BFL is the firm proposed to be converted to a Bank if this application is successful. There may however be a need for a restructuring within the Bajaj group as after getting banking license there cannot be any preferential treatment to Bajaj Auto.
  • BFL was rated by Aon Hewitt as one of the top employers in India in terms on Employee Satisfaction.
  • Other business achievements – It is the first NBFC to launch online personal loans. It is among the few NBFC with active co-branded credit card (with Standard Chartered Bank. It is the first NBFC to tie up with UIDAI to access Aadhar card/eKYC database.
  • The recent Q3FY14 results were good. AUM grew 33% to 22,461 cr; customers acquired during Q3 rose 15% YoY to 9,62,204 and deployments climbed 45% YoY to 7,532 cr.

Industry Note

  • There are a large number of NBFCs in India (>10,000). These are relatively unregulated companies, unlike Banks that are governed by RBI. In this fragmented market, there is tremendous opportunity to offer Loans and Financial services.
  • RBI has projected a 14% growth in loans for Banks; NBFCs should have higher industry growth rates of 24% for the next five years. (ICRA/ industry experts).
  • Inflation and Interest rates are at highs in Q4 of FY14, which is difficult for the sector. However the 2 year outlook is a slow fall in both, even as the investment cycle recovers in India.
Unique Strengths
  • BFL shares the strong ‘Bajaj’ brand; and is part of the growth of Bajaj Auto through Auto loans. BFL has a wide presence and leadership in high value Consumer Electronics and retail loans.
  • BFL is diversified across customer segments and geographies; this de-risks operations and inspires a confidence in continued growth. BFL has a presence in 7 business sectors (Fig 1) and is nimble enough to shift focus to the performing sectors in order to achieve its targeted growth.
  • The group financial services ambitions and new initiatives are going to be routed through BF.
  • A strong distribution network, spread nationally with presence across customer segments, industries and geographies. The BFL strategy is to diversify their loan exposure with a 30% cap on each segment. This will provide a de-risked business model.
  • With a wide product portfolio, BFL targets cross-selling and up-selling products to its customer base.

Stock Evaluation, Performance and Returns

  • Listed since 1994, BFL performed well over the last 6-8 years, as seen in Fig 3.
  • A sharp fall in price around Jan-Mar ‘13, was caused in part due to the rights issue.
Share Price History, JainMatrix Investments
Fig 3 – Share Price History, JainMatrix Investments
The fall we see around August ’13 is linked to the events of 1) threat of stoppage of the Quantitative Easing program in USA, 2) fall in INR v/s USD value. Most Bank share prices in India fell at this time.
Bajaj Finance, Quarterly Growth Growth of Income, Profits, JainMatrix Investments
Fig 4 – Bajaj Finance, Quarterly Growth of Income, Profits – JainMatrix Investments
The Growth of Total Income, Net Interest Income, Net Profits and EPS TTM has been very steady since June 2008, see Fig 4.
Price, P/BV ratio, Dividends, JainMatrix Investments
Fig 5 – Price, P/BV ratio, Dividends, JainMatrix Investments
  • The Share price has appreciated by 28% CAGR over the last 9 years. However, post the 2009 fall, the appreciation has been very steep at 86% CAGR over 5 years, mapped in Fig 5.
Price PE chart, JainMatrix Investments
Fig 6 – Price PE chart, JainMatrix Investments
  • Price and PE chart Fig 6, indicates that the PE is distributed over a range of 8-32 times, with the 8 year historical average of 20 times.
  • It shows that PE is currently near all-time lows even though the Price is at all-time highs. It seems the full effect of the Earnings improvements is not yet reflected in the Price.
Price EPS chart, JainMatrix Investments
Fig 7 – Price EPS chart, JainMatrix Investments
  • The EPS growth has accelerated since 2010, (Fig 7). This is an excellent chart of the firm’s growth. The EPS appears to be in a channel – of blue lines, and on a good growth path.
  • Dividend yield by the company is 0.95%. Dividend rate has increased steadily over the last 5 years.
  • We can trace the financial metrics of Return on Net Worth, Return on Capital Employed and Tier 1 Capital Adequacy in Fig 8. ROCE is 16% and RONW is 17.6%, in FY13. These are good ratios.
  • Today, BFL has a tier-1 capital adequacy ratio at 17.7% (Sept’13). This is at a comfortable level to fund rapid growth and meet the standards for the sector.
  • NIM has fallen to 11.7% but this is driven by higher share of secured loan products.
  • Gross NPA increased from 1.14% to 1.15% while net NPAs declined from 0.26% to 0.23 % YoY.
Financial Metrics, JainMatrix Investments
Fig 8 – Financial Metrics, JainMatrix Investments
  • P/BV is 2.35 today which is a fair level, not overpriced.
  • The PEG today is at 0.48 – indicates undervalued status.

Risks:

  • Our base case assumes BFL wins the Banking license, and needs to restructure and invest in itself to re-launch as a bank. The share price will surge post this prestigious win. But in case it does not win this, restructuring costs will be lower and profits higher; but the share price may see some fall.
  • High Inflation. If the current high inflation in India cannot be tamed, it will affect BFL business.
  • Our base case is a mild economic recovery in India. However, if the Indian economy continues to show flat or poor growth, the BFL growth will be hit.
  • Promoter driven consolidation. Bajaj group has other financial firms like Bajaj Allianz (Insurance), Bajaj Financial Solutions (Wealth management and advisory) and Bajaj Finserv. Consolidation will change the outlook and business strategy of BFL.
  • The worse performing business lines have been Infra and commercial lending, which have been pared down over the last two years. No fresh losses should emerge from this loan book.

Peer benchmarking and Financial Estimates

BFL is compared to some of its peers to understand and benchmark its key ratios. See Exhibit 9.
Peer Benchmarking, JainMatrix Investments
Exhibit 9 – Peer Benchmarking, JainMatrix Investments
  • BFL leads in ratios of growth and Returns.
  • Behind a national major like HDFC, it leads across most parameters.
  • It appears undervalued at Current Market Price.
Three-year projections of BFL financials indicate a robust ramp up of revenues and profits, Exhibit 10.
Financial Projections, JainMatrix Investments
Fig 10 – Financial Projections, JainMatrix Investments
  • Review of Projections from the Jan 2012 report on BFL. While the firm actually exceeded our projections for FY12 and the Profits for FY13 were lower by just 9%, we noticed that the volatility in Banking/ NBFC sector pulled down the valuation & price from our estimates by 35% by end FY13.
  • In the next 2-3 years, this should reverse and the valuation multiples should rise.

Opinion, Outlook and Recommendation

  • Indian market is underserved for loans and financial services. Quick calculations show BFL has 2-3% market share among Indian NBFCs (non-Bank). While small, this indicates a big opportunity for BFL.
  • In India, Consumer debt/ GDP is 9%, low compared to S.Korea 80%, European>50% and China 12%.
  • BFL is a firm gifted with an outstanding, valuable brand, positive image and good reputation. BFL is well placed to capitalize on this by growing into a financial powerhouse with businesses into insurance, loans and finance.
  • In the past few years, BFL has embarked on a business trajectory that, if sustained, can make it a top 5 NBFC in 4-5 years. In essence it may move from mid-cap to large-cap, and shareholders could gain considerably.
  • Invest now and systematically for long-term out-performance.
Source: http://jainmatrix.com/2014/01/23/bajaj-finance2014/